In this post I discuss the outlook for the 2022/23 winter from a UK perspective: what do the forecasts predict and what physical drivers might influence the upcoming winter?
15 Sep, 2022
9 min read
An important winter
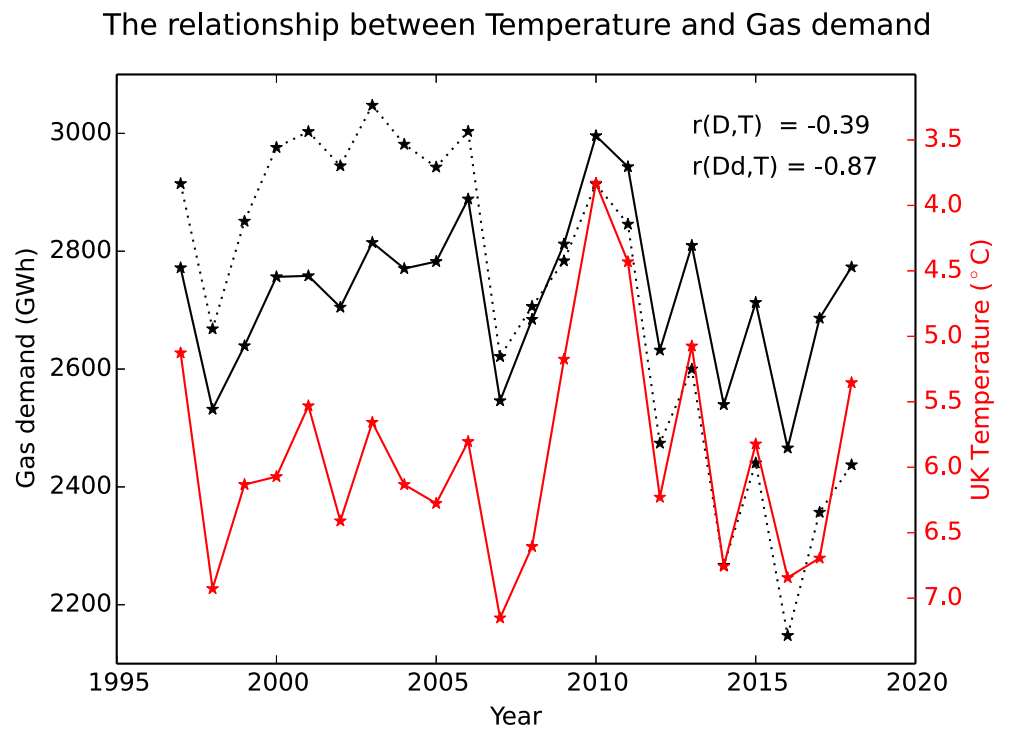
The price of utilities has risen dramatically over the last year for people, businesses and organisations in the UK. As we move towards winter there is great concern about the effect of these price rises on peoples lives. In the UK, winter temperatures have a strong impact on the demand for gas and electricity. For example, a winter with a 1 degree temperature anomaly resulting in roughly a daily average gas demand anomaly of 100 GWh over a winter season:
UK gas demand is strongly negatively correlated with UK temperature. From Thornton et al. (2019).
In monetary terms, based on the the UK October gas price cap (i.e. 10.3p/kWh), this equates to about £1 billion for each 1 degree UK temperature anomaly (though likely much higher due to the higher unit costs for businesses/organisations - not to mention the governments costs to underwrite the price cap). The numbers are pretty big, and the stakes are pretty high.
What do the forecast models predict?
So can we predict what is in store for the UK this winter? Seasonal forecasts out to six months in the future are performed operationally by weather centres across the world. The European Commission’s Copernicus Climate Change Service (or, more snappily, “C3S”) coordinates these long-range forecasts from 7 international centres (including the UK Met Office). When forecasting many months ahead we cannot predict the weather on a particular day, however, forecasts demonstrate some skill in determining average conditions on monthly timescales.
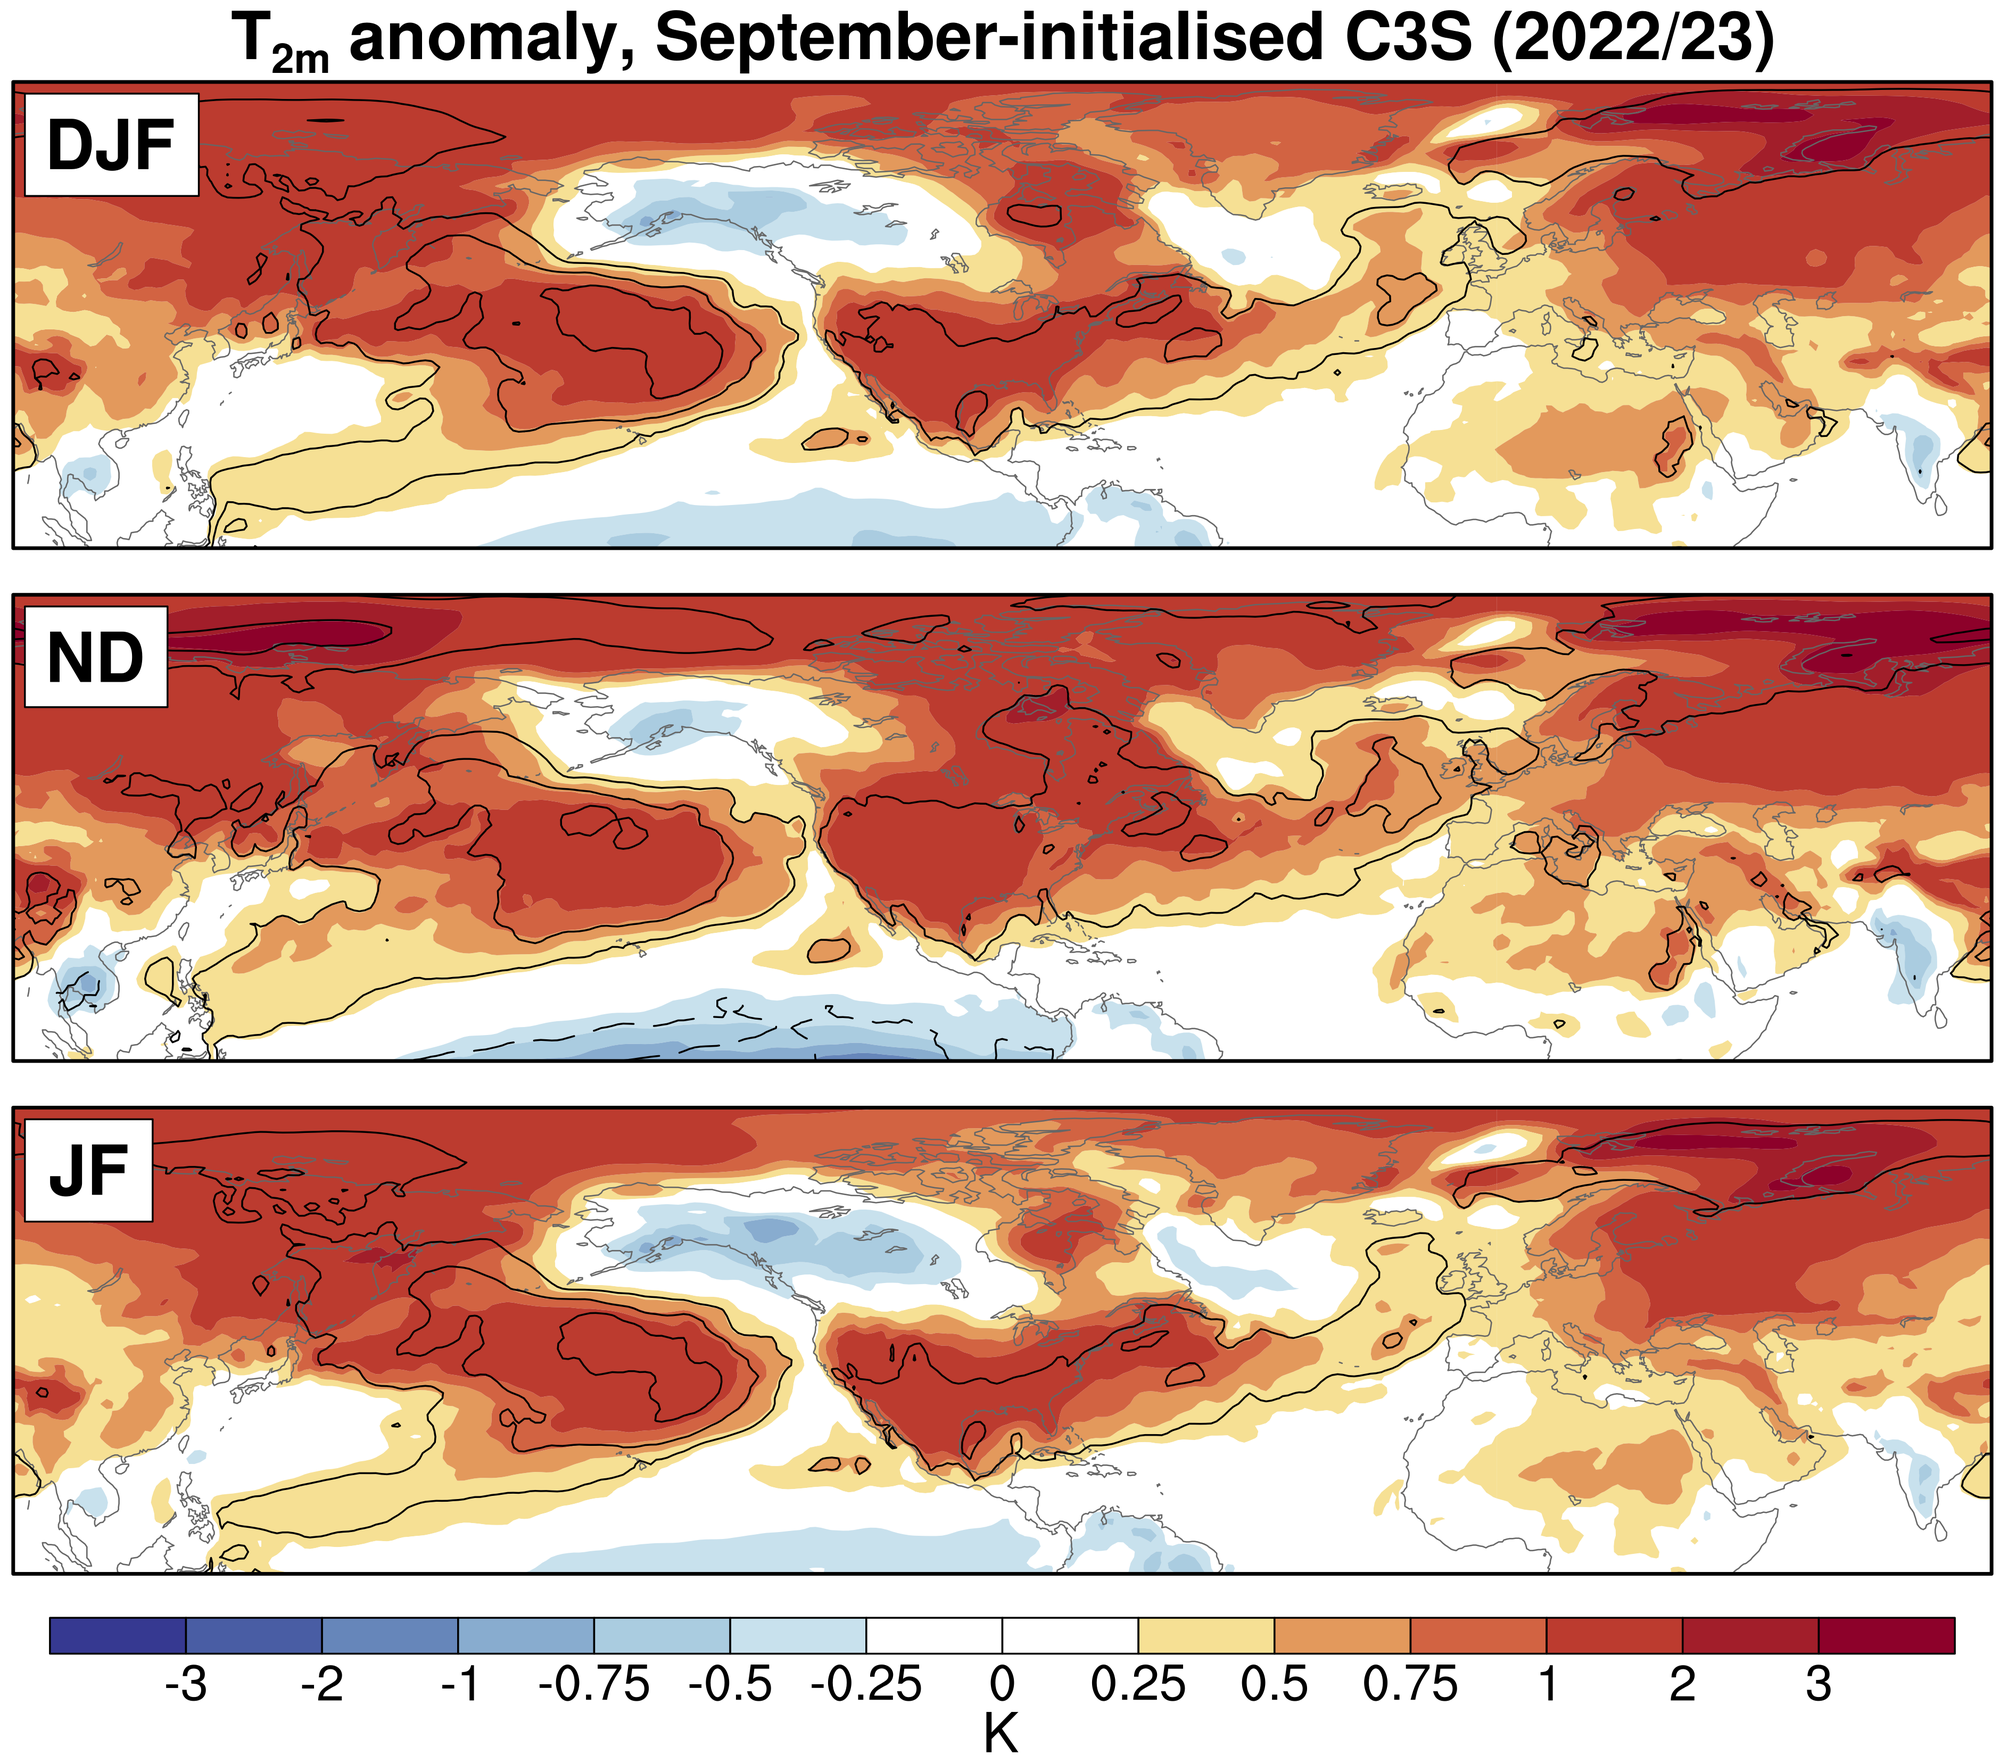
The surface air temperature anomalies from the C3S multi-model forecasts are shown below. There are warm anomalies over the UK, over both early winter (November/December) and late winter (January/February):
Ensemble mean 2m temperature anomaly from the C3S multi-model seasonal forecasts. The anomalies are relative to the climatology calculated from the hindcasts over 1993-2016. The black lines show where the ensemble mean anomaly exceed the 0.4 standard deviations of internal variability, calculated relative to the variability of the hindcasts.
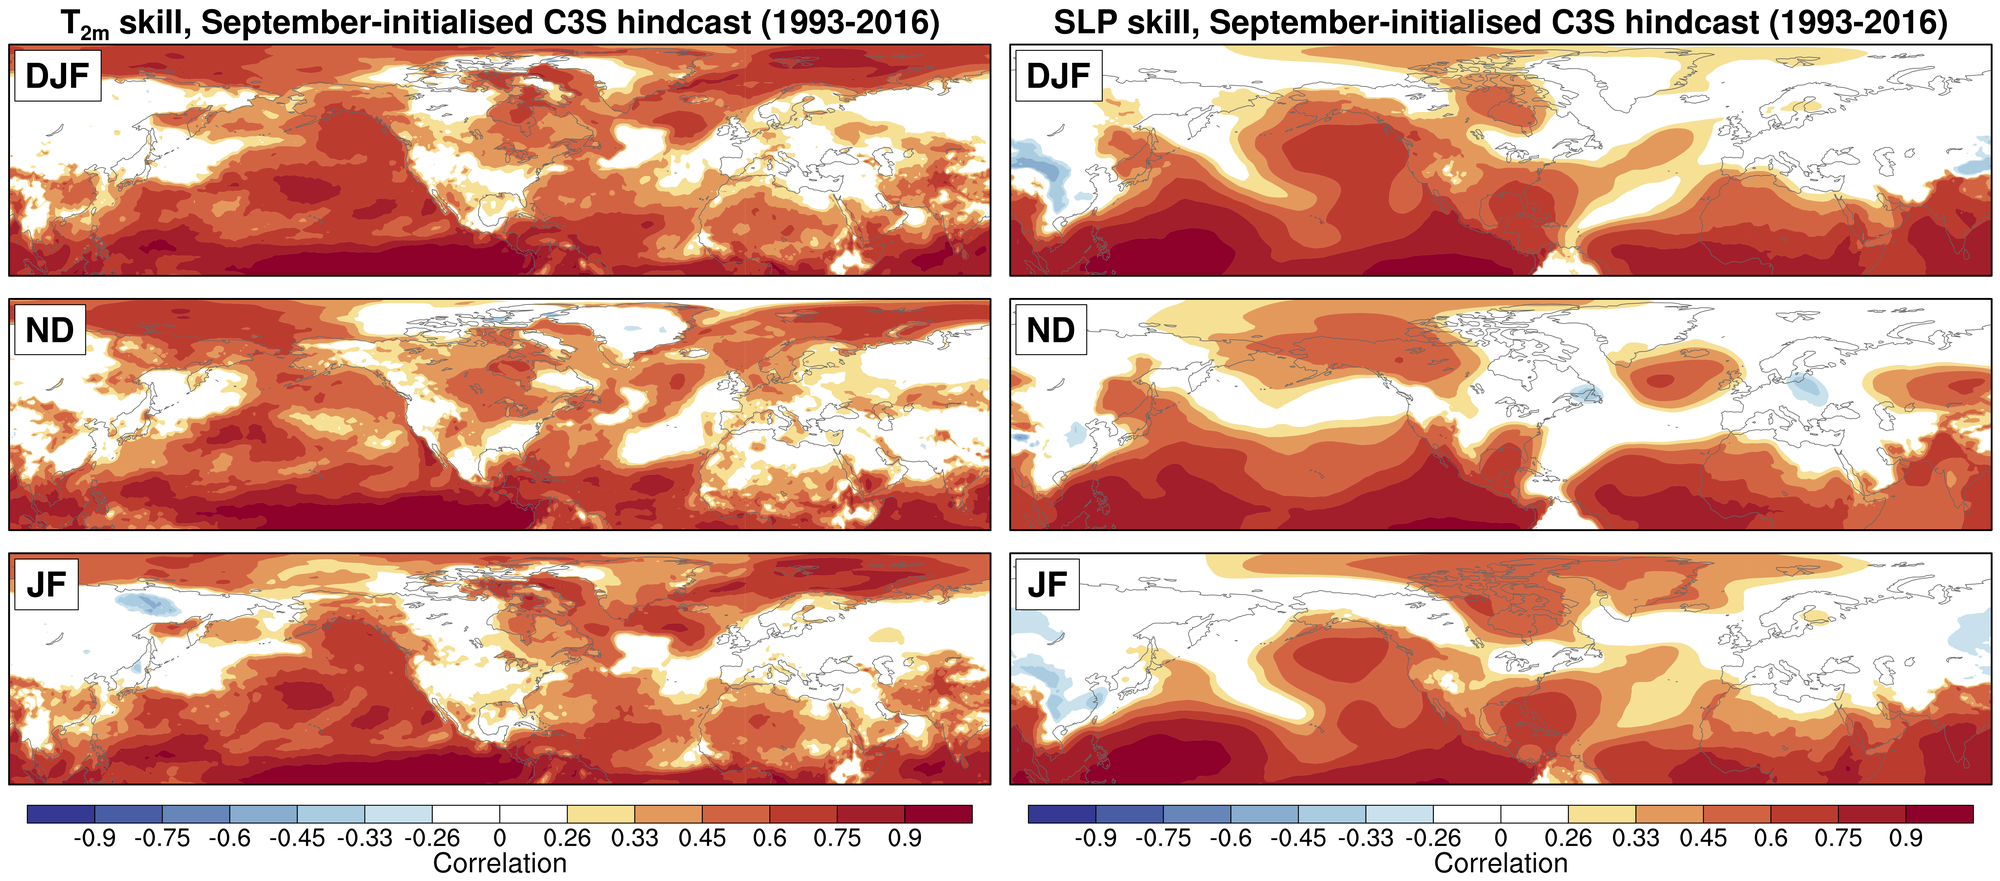
However, these 2m temperature forecasts should be treated with caution because over Europe, and particularly over the UK, they do not demonstrate clear skill. The following plot shows the correlation skill of 2m temperature and sea-level pressure for the C3S multi-model seasonal forecasts:
Ensemble mean correlation skill for the C3S multi-model hindcasts (initialised on 1st September). The skill is shown for three periods: December-January-February (DJF), November-December (ND), and January-February (ND).
Over the UK there is little skill in 2m temperature; however, there is skill in the sea-level pressure over the North Atlantic and this can be utilised to provide predictions of the UK temperature (as demonstrated in several studies1).
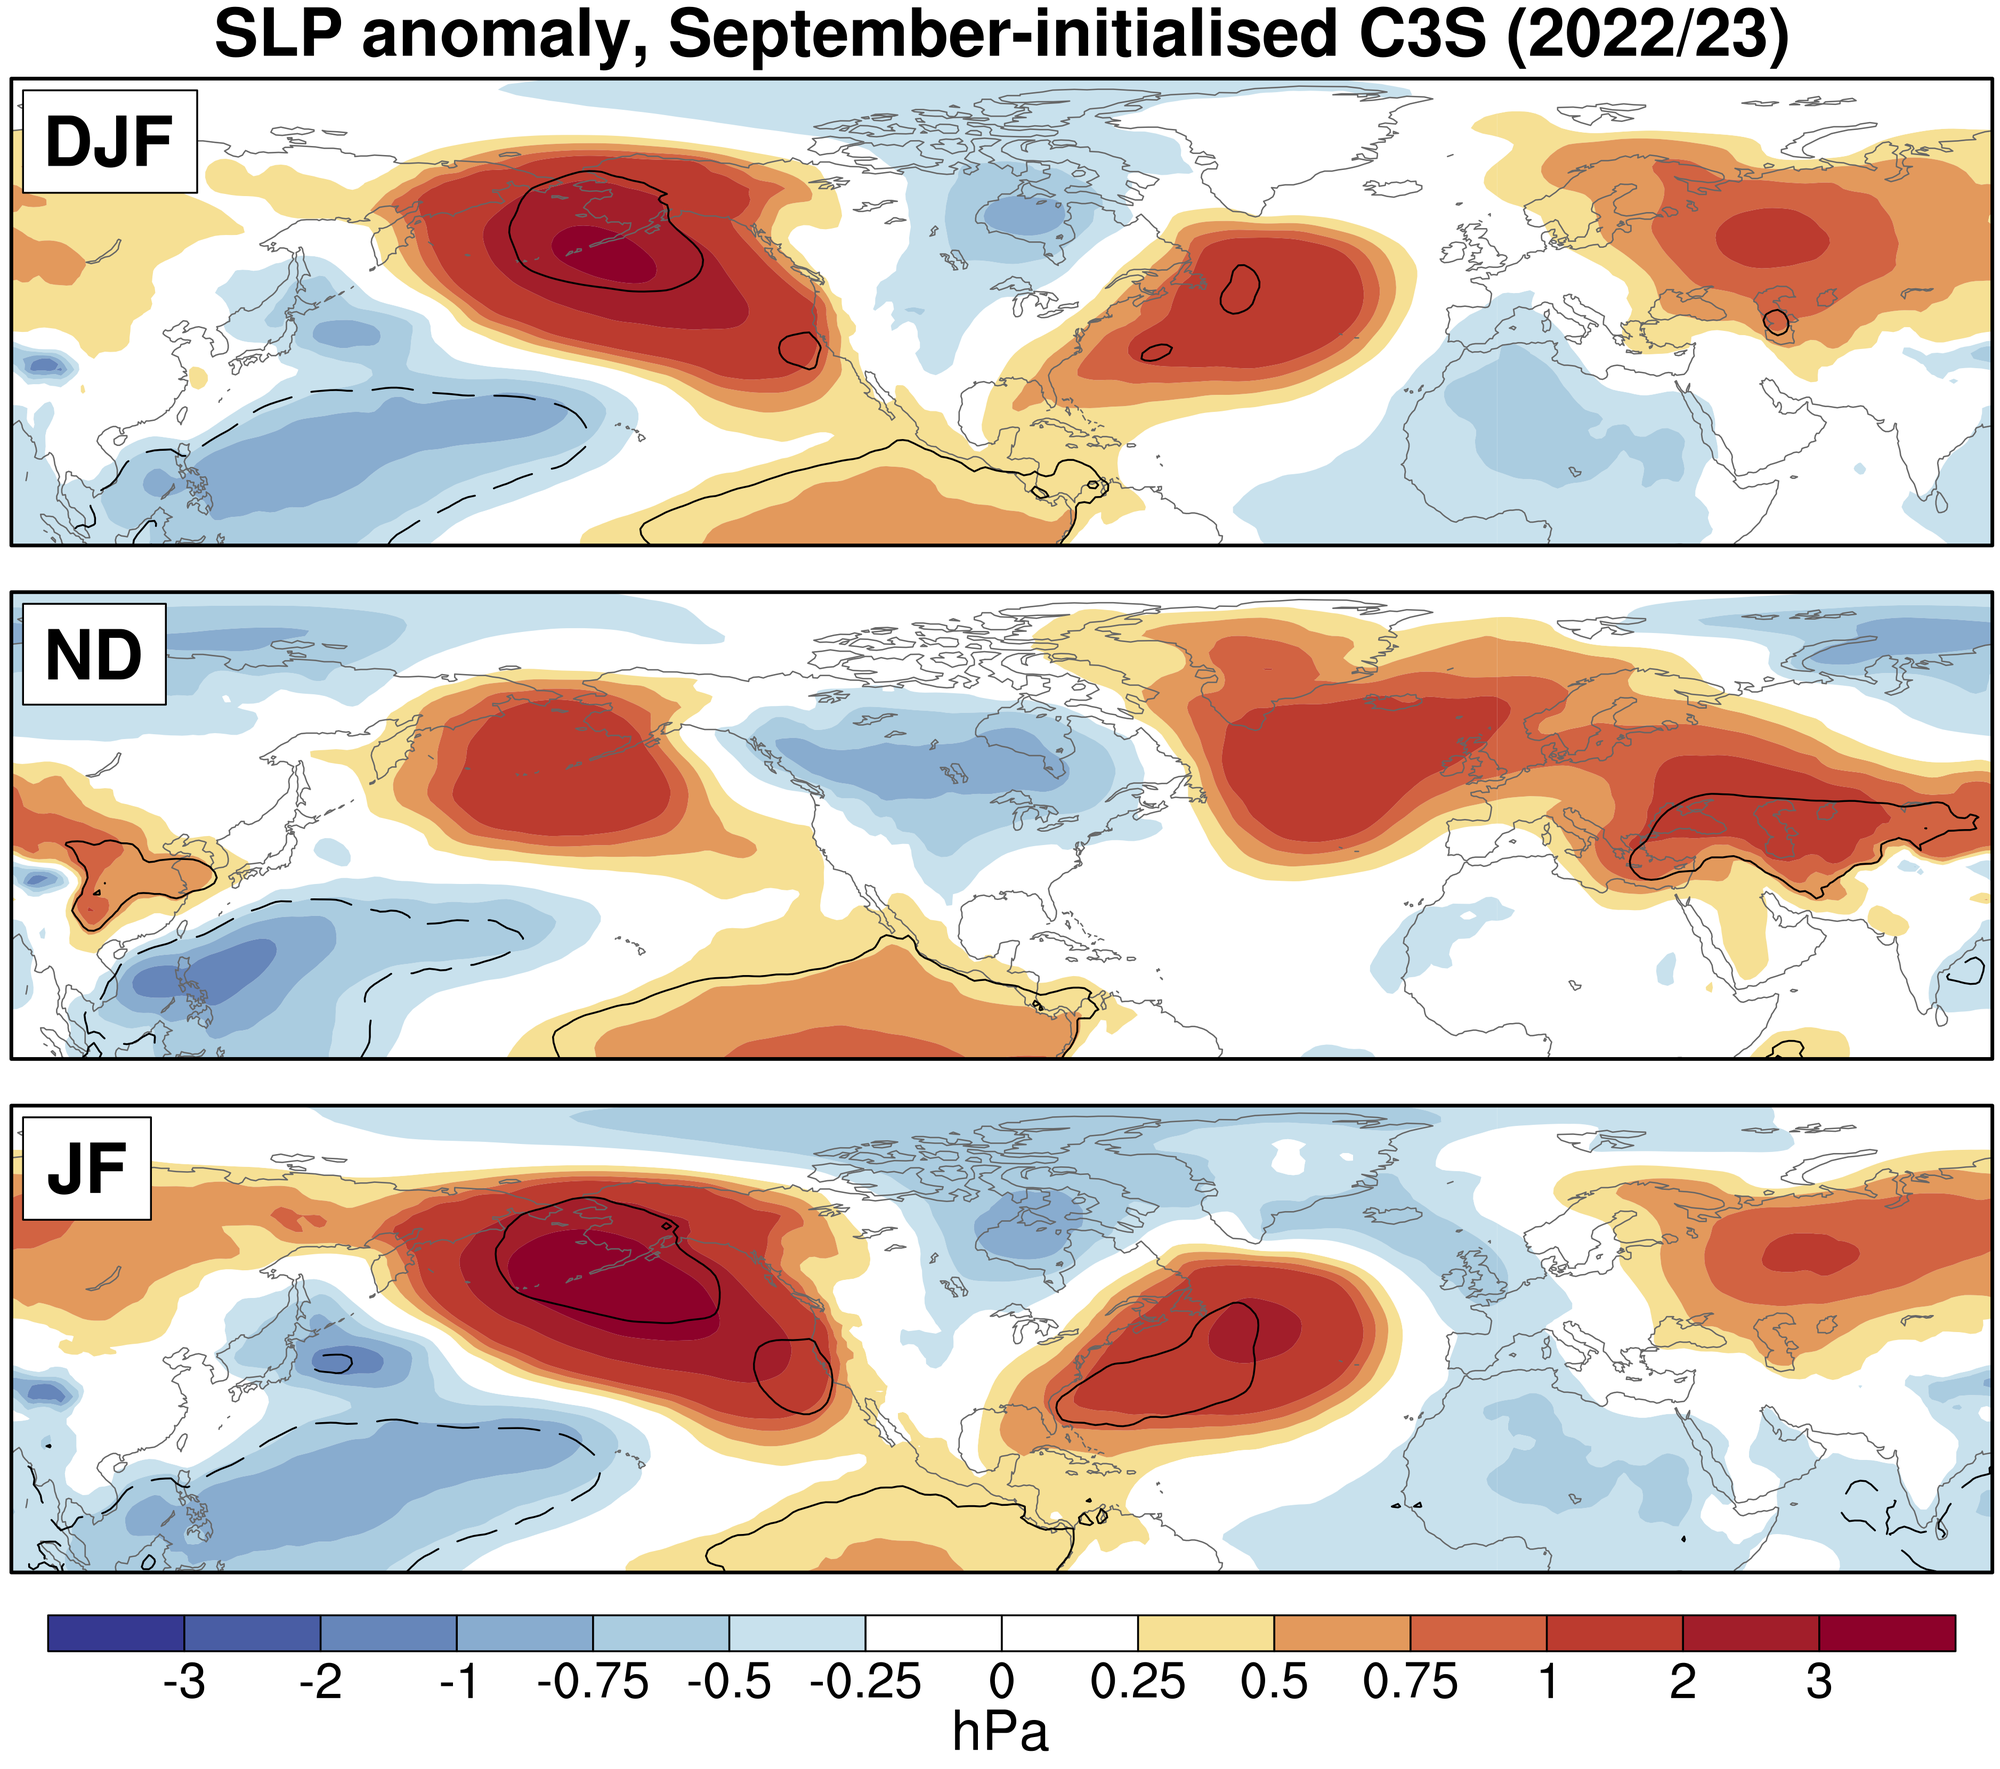
For the upcoming winter it is useful to first consider predictions of the large-scale atmospheric circulation because the winter temperatures in the UK are largely determined by wind anomalies (and the associated advection) in the surrounding Euro-Atlantic sector. The multi-model forecasts of the sea-level pressure anomalies for the 2022/23 winter are plotted here:
Ensemble mean SLP anomaly from the C3S multi-model seasonal forecasts. The anomalies are relative to the climatology calculated from the hindcasts over 1993-2016. The black lines show where the ensemble mean anomaly exceed the 0.4 standard deviations of internal variability, calculated relative to the variability of the hindcasts.
The sea-level pressure anomalies over the North Atlantic exhibit notable changes in characteristics between early winter and late winter. In the early winter period (ND) there are high pressure anomalies across most of the midlatitude North Atlantic, extending into Europe. In the late winter period (JF) there are low pressure anomalies over Iceland and high pressure anomales further south, more closely resembling the positive phase of the North Atlantic Oscillation or “NAO”, which typically causes warmer winters in the UK. But what is driving these signals?
La Nina conditions in the Tropical Pacific
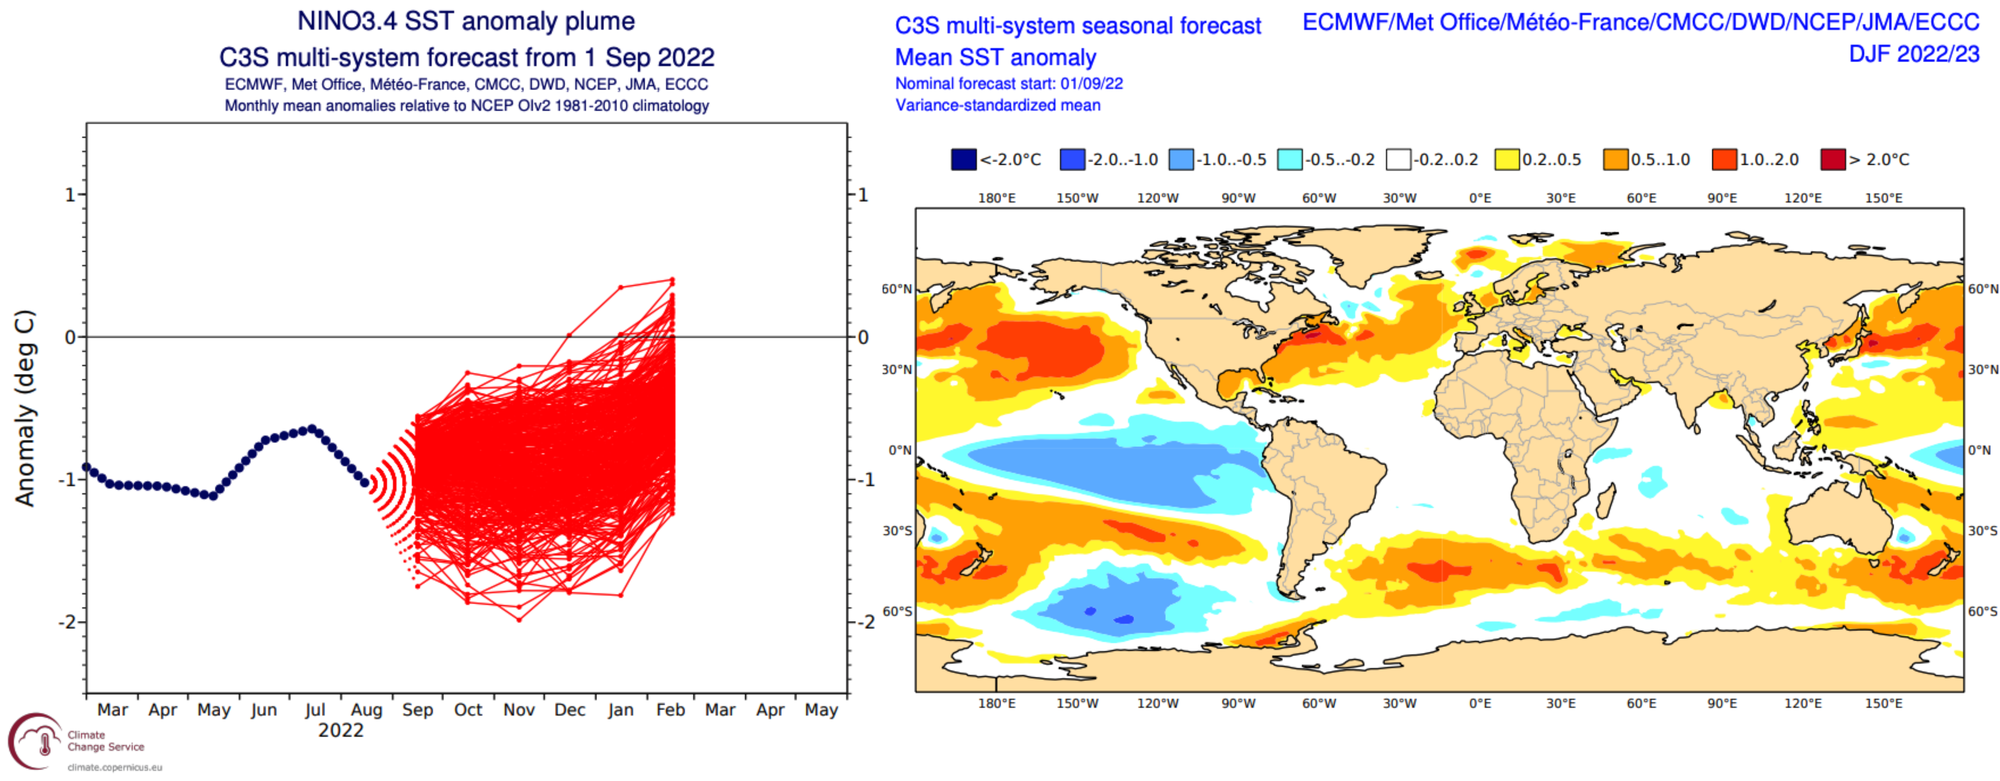
As we approach this winter, forecasts are confident that we will have La Nina conditions, associated with cooler sea surface temperatures in the eastern/central Tropical Pacific:
Nino 3.4 index and ensemble mean SST anomalies from the C3S multi-model seasonal forecasts. The anomalies are relative to the climatology calculated from the hindcasts over 1993-2016. These plots - and more - are available from the C3S website.
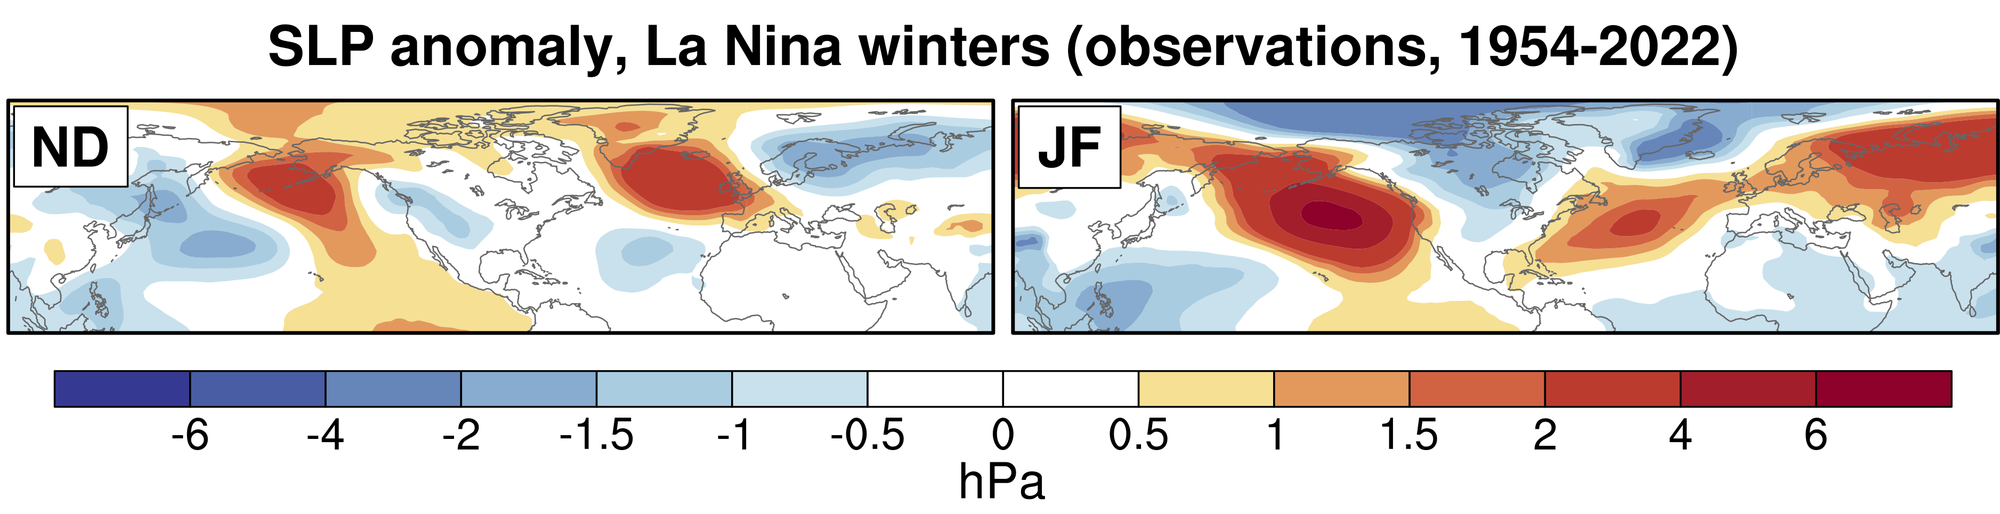
The observed impact of La Nina on the large-scale atmospheric circulation in the Euro-Atlantic sector shows a clear difference in the early winter compared with late winter (analysed in detail in some nice recent studies2). Composite anomalies during observed La Nina years are shown here:
Observational SLP anomalies for the early winter (ND) and late winter (JF) during La Nina winters with respect to other years (1954-2022). There are 24 La Nina winters over this period, defined using the Oceanic Nino Index. These maps were produced using the NCEP-NCAR reanalysis - because it is oh-so-easy to grab.
The resemblance of this observational composite plot to the predictions from the seasonal forecasts (i.e. Figure 4) is very clear. In the early winter the ridging over the North Atlantic is followed by the emergence of positive NAO conditions in late winter. The La Nina conditions are clearly, and I suppose obviously, driving the circulation anomalies in the seasonal forecasts and the comparison with observations suggests that this is sensible forecast3.
A possible role for the Quasi-Biennial Oscillation (QBO)?
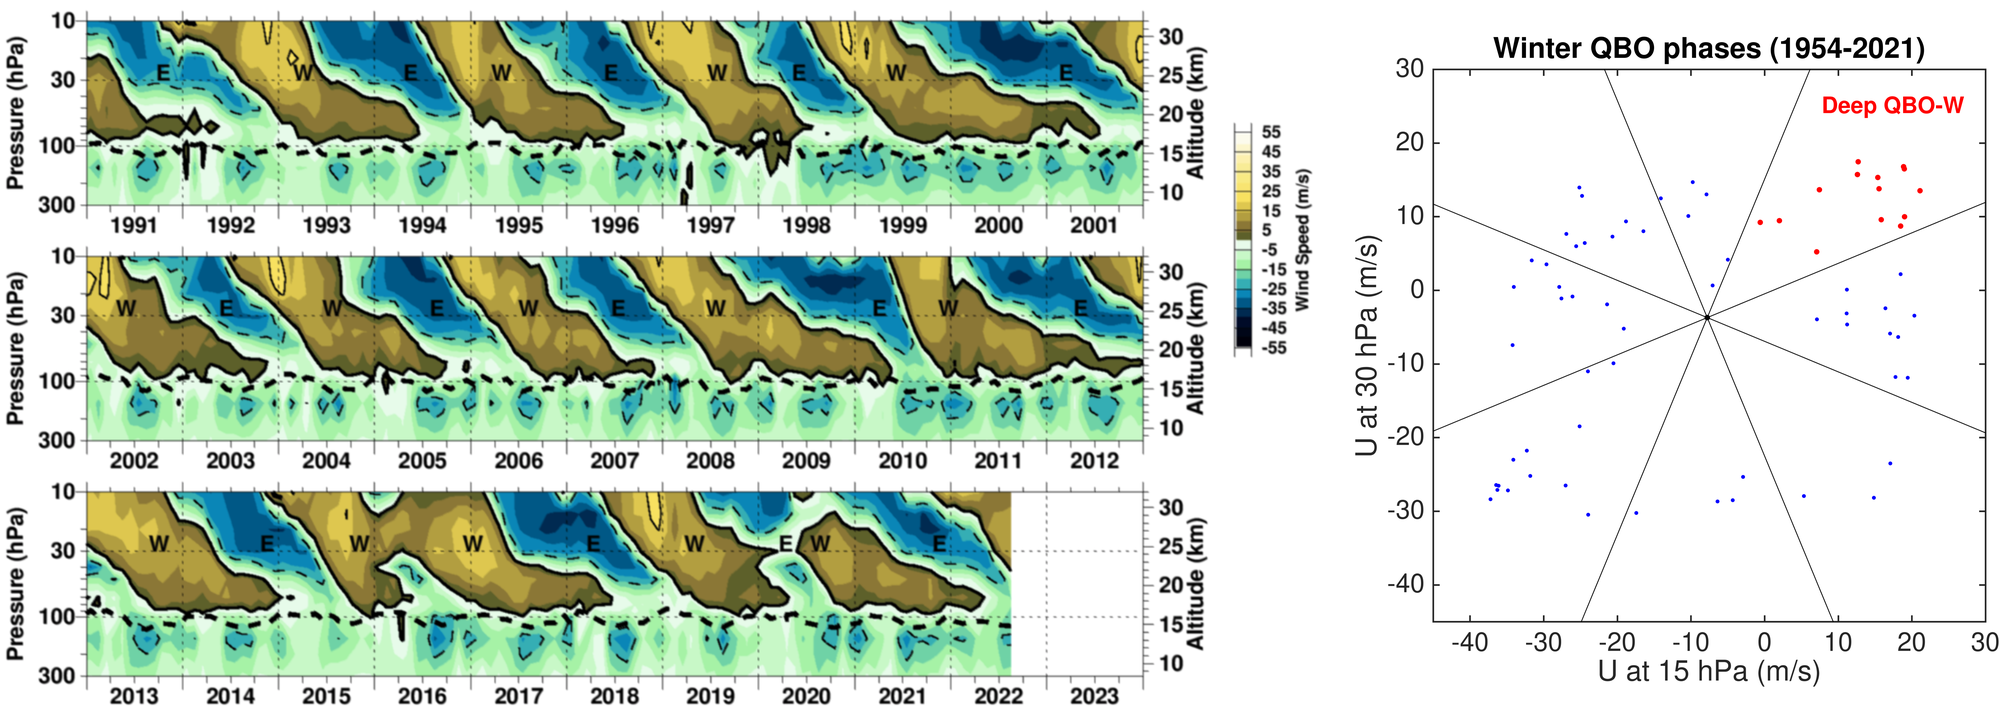
Another driver that can confidently be predicted (mostly) several months in advance and can influence the extratropical large-scale circulation is the Quasi-Biennial Oscillation (QBO). The QBO refers to the equatorial winds in the stratosphere that oscillate between eastward and westward phases, which have been shown to influence the large-scale tropospheric circulation in the Euro-Atlantic region4. The QBO is currently in a “deep” westerly phase, with strong westerly winds that span the depth of the equatorial stratosphere:
Observations of the equatorial winds in the stratosphere from the FUB radiosonde dataset (plot from the NASA-GSFC website). The current winter fits in the Deep QBO-W phase in the phases diagram on the right (produced by plotting the observed zonal winds at 30hPa and 15hPa, following Andrews et al. (2019))
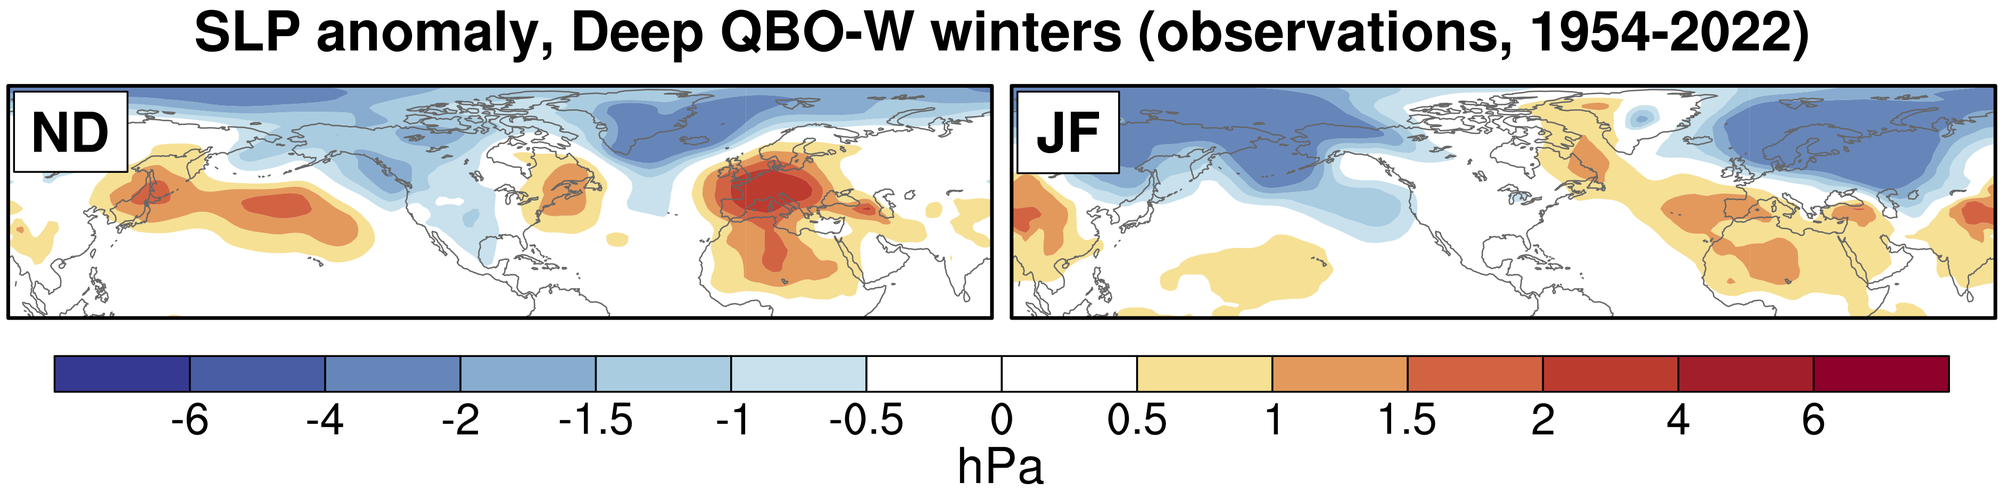
Composite anomalies of QBO-W winters from the observations demonstrate a clear signal in early and late winter, both of which project onto the positive phase of the NAO:
Observational SLP anomalies for the early winter (ND) and late winter (JF) during Deep QBO-W winters with respect to other years (1954-2022). There are (only) 14 Deep QBO-W winters over this period.
The observational composites suggest that the current winter might be more likely to be in a positive NAO phase throughout. A number of studies have shown that seasonal forecasting models capture the correct sign of the relationship between the QBO and the NAO but that it is substantially weaker than in observations5. We might therefore reasonably expect/anticipate/suppose that this effect is not adequately represented in the forecasts for this winter.
What does this mean for UK temperatures?
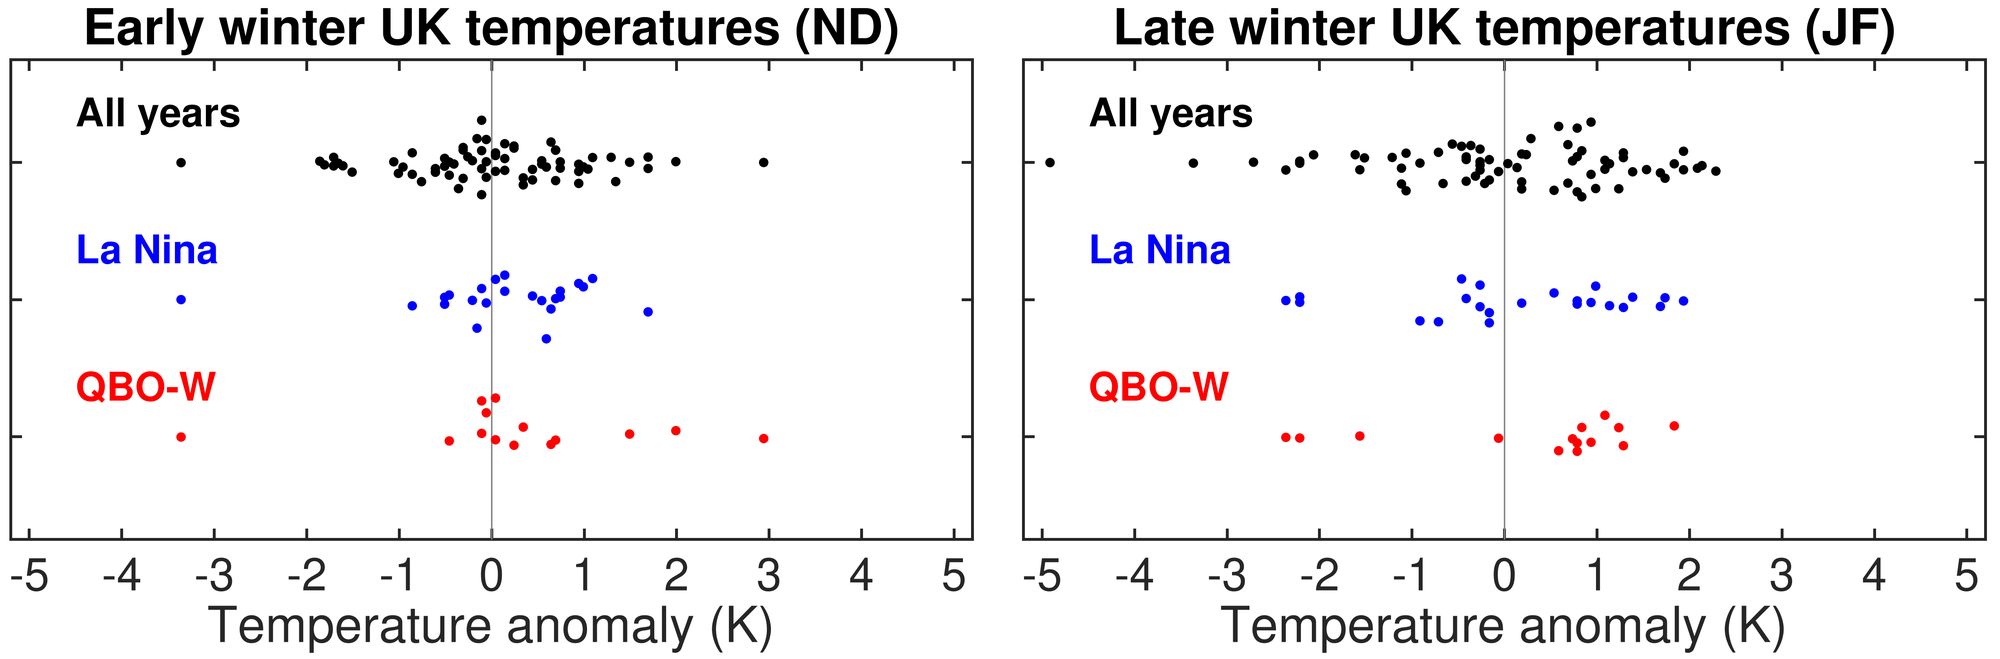
A simple way to consider what all this means for UK temperatures is to look at the distribution of UK winter temperatures in the observational record:
UK temperatures for the early winter (ND) and late winter (JF) all years in the period 1954-2022, as well as during La Nina winters and deep QBO-W winters. The data is from the HadUK-grid dataset.
The La Nina and deep QBO-W conditions tend to favour milder winters for the UK, however, there remains significant variability. For example, the record cold period during early winter in 2010/11 occurred during La Nina and deep QBO-W conditions (and possibly linked to North Atlantic SST anomalies6). Nonetheless, the drivers analysed here tend to favour circulation anomalies in both the early and late winter that favour milder UK conditions, and support the signals seen in the seasonal forecast models.
So we can be cautiously optimistic…?
Milder conditions would certainly be welcome this winter in the UK so its positive that the forecasts and drivers seem to point in this direction. However, there is of course still a clear possibility for cold conditions. One possible cause would be a sudden stratospheric warming event, in which the stratospheric polar vortex breaks down, favouring the development of negative NAO conditions and associated cold conditions in the UK. An example of this was the “Beast from the East” event in February 2018. Weather geeks get very excited about sudden warmings - and understandably so - but we might hope to forego such excitement this winter. The C3S seasonal models show no clear signal on the probability of a sudden stratospheric warming event occurring at present7.
So milder conditions might be on the cards for the UK this winter, which would be good news. But warmer winters also tend to be wetter here in the UK, so at least we’ll still have that to moan about.
I might try to update this as we get a bit closer to the winter, either here or on another post. Do let me know if you have any thoughts or suggestions.
Though there is skill in seasonal sea-level pressure predictions, the amplitude is generally too weak, which means that the impact on the 2m temperature is also very weak in the ensemble mean. E.g.: Scaife et al. (2014), Stockdale et al. (2015), Scaife & Smith (2018). ↩︎
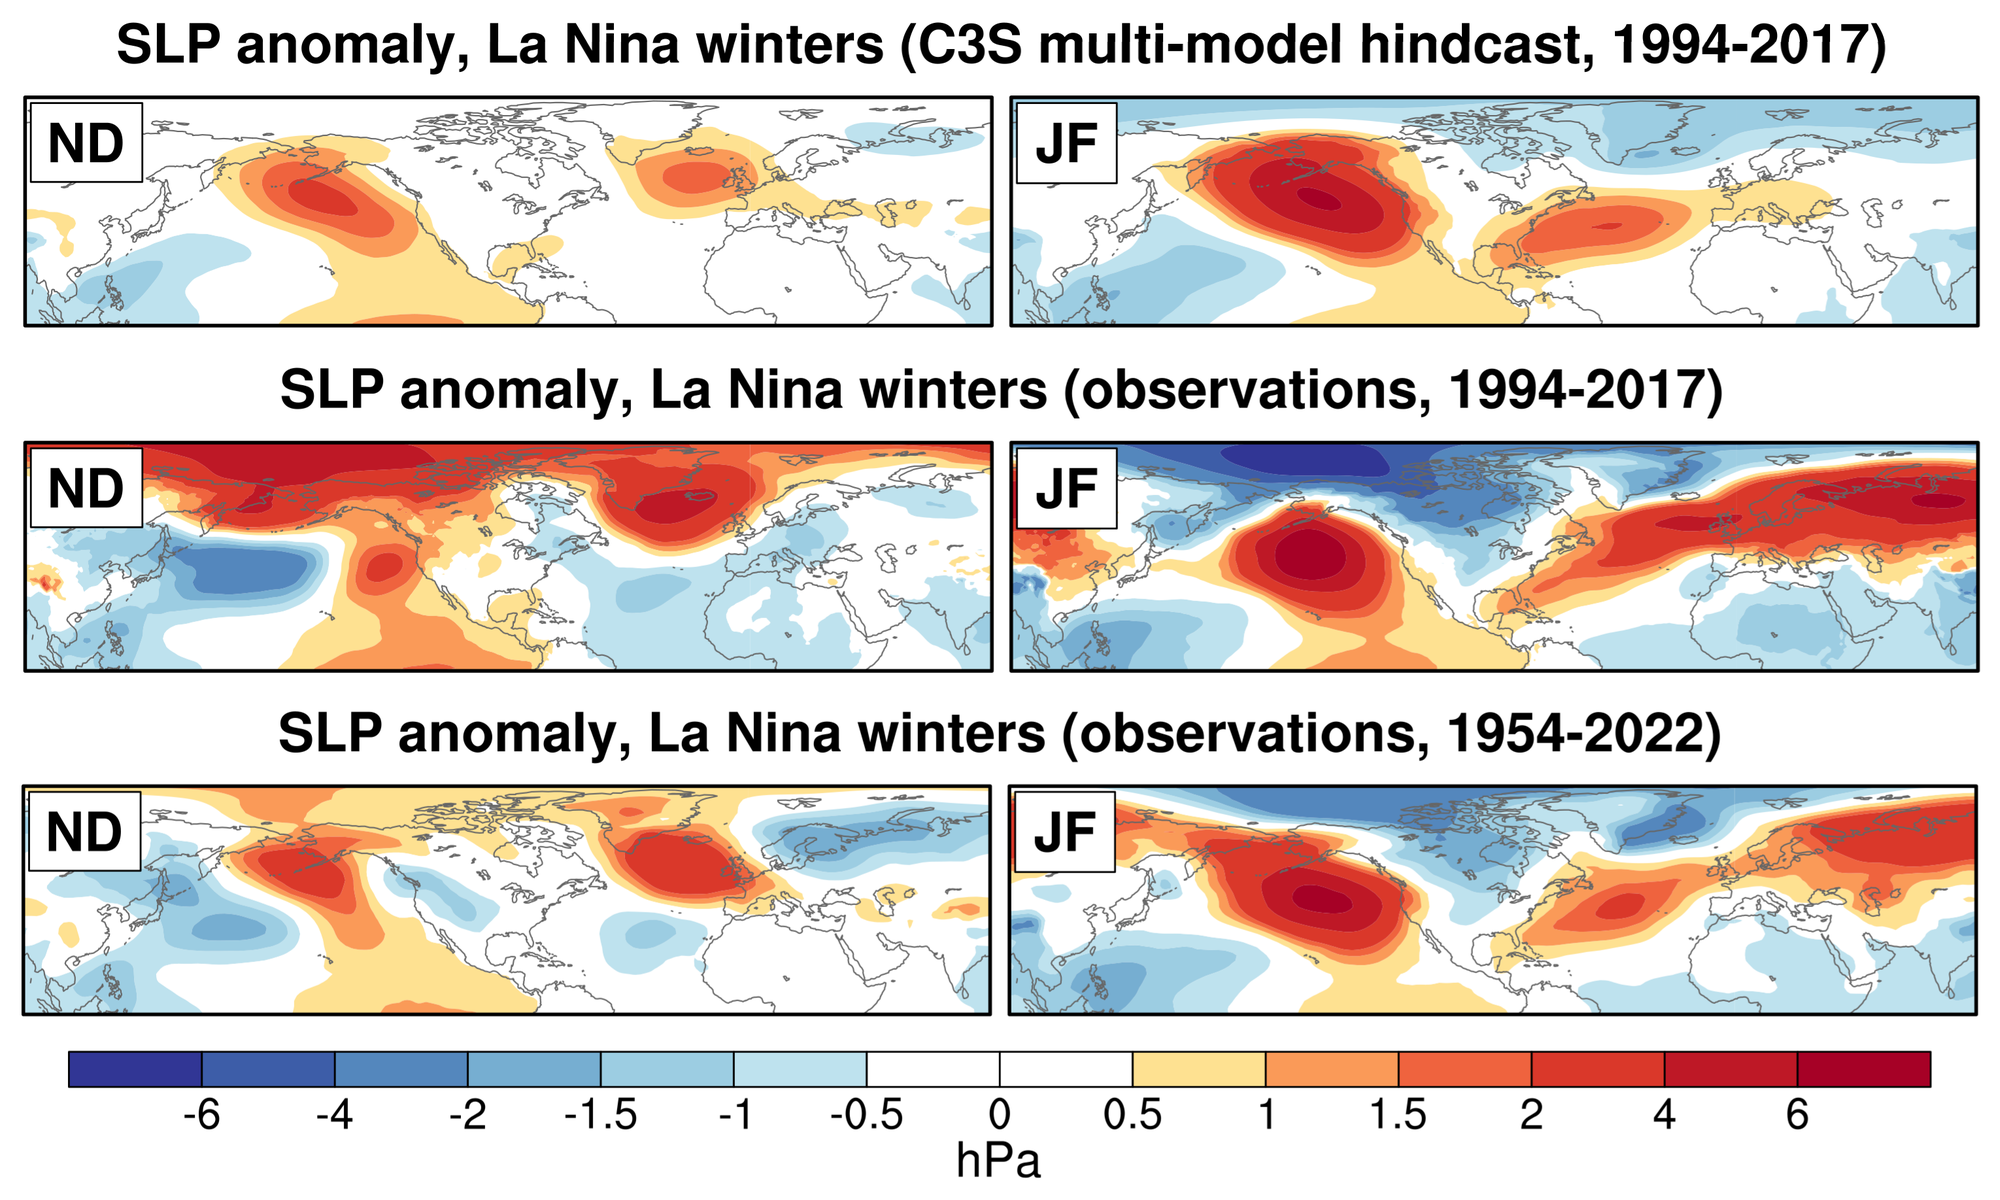
(Added 20/9/22 following a great question from my colleague Kristian Strommen on Twitter). It seems that the C3S models do a reasonable job but perhaps underestimate the strength of the teleconnection to the North Atlantic in the winter, which would mean that the sea-level pressure signal in the 2022/23 forecast might be too weak. The following figure shows the SLP anomaly in the C3S runs and observations in La Nina winters compared to all other winters. The sample sizes in the observations are obviously quite small when just looking at the C3S period (1994-2017).
↩︎
This is not surprising as at long lead times such as this, i.e. a couple of months, but these things can quickly change, as shown in a recent paper by Lockwood et al. (2022). ↩︎